
10 STATISTICS CONCEPTS YOU SHOULD KNOW FOR YOUR NEXT DATA SCIENCE INTERVIEW
Statistics concepts will support you to ace your next Data Science Interview with confidence.
Data Science is a multidisciplinary field of study with a major thrust on Statistics. Several statistical techniques have been used for analyzing and interpreting data, representation of data, and building models for predictive and prescriptive analysis. Some of the most commonly used statistical methods for analysis include Descriptive statistics, Hypothesis testing, Time series analysis, classification, correlation, and regression, etc. Based on these statistical methods and techniques, researchers conduct many tests and interpret the outcomes. Henceforth, for data scientists, it is essential to have a good foundation of statistics.
Statistical concepts significant for the purpose of data science are many. A few of the concepts that a prospective data scientist preparing for an interview should know is detailed in this article
1) Descriptive Statistics (For summary statistics)
Descriptive Statistics is a type of statistics that are used for summarizing and describing the characteristics of data set at hand through certain measures like mean, median, and mode, so the data can be understood more easily. The purpose of descriptive statistics is to determine whether the sample is normally distributed. Moreover, it is displayed through charts, frequency distributions, tables, and also it is generally reported as a measure of central tendency.
The following details about the data are included in the Descriptive statistics
- Central Tendency
- Mean – also known as the arithmetic average of the values.
- Median – The middle value of the given dataset is arranged from least to greatest.
- Mode – The value that occurs most frequently in the given dataset
Depending on what we are exactly trying to narrate, based on that we will be using different measures of central tendency. For numerical data, mean and median have been used, but the mode is used for both numerical and nominal data.
- Measures of Dispersion
- Range –The understanding of how to spread out the given data is given by Range.
- Variance – The understanding of how far the measurements are from the mean is given by Variance.
- Standard deviation –Standard deviation means the square root of the variance, as well the measurement of how far the data deviate from the mean
- Skewness – Skewness refers to a distortion or the measure of the asymmetry of a distribution of a variable about its mean.
- Kurtosis – Kurtosis gives us an understanding of how closely the data is spread out and also it is the measure of the “tailedness” of a distribution of a variable.
For examining the given data, descriptive statistics are extremely useful. Moreover, with the usage of descriptive statistics, we can get a complete understanding of the data.
2) Covariance and Correlation (For relationship analysis)
Covariance represents how much the variations of two variables match each other and also it is a quantitative measure. When it is more specifically narrated, covariance is used to compare two variables in terms of the deviations from their mean or from the expected value.
In statistical concepts, correlation is one of the most widely used. The association between quantities or mutual relationships refers to the term “correlation”.Especially, in the case of business, it is convenient to convey one quantity in terms of its relationship with others. For instance, for increasing sales, the marketing department spends more on promotions like TV advertisements or a customer’s average purchase amount on an e-commerce website might depend on various elements related to that customer. Frequently, correlation is the beginning to understanding these bonds and eventually building a strong base for the business and statistical models. Some of the reasons, why correlation is a useful metric:
- Correlation can support in predicting the quantity from one another.
- The presence of a causal relationship can be indicated by Correlation.
- In various types of modeling techniques, Correlation is used as a basic quantity and foundation.
In the above, it is mentioned that the relationship between two variables is measured by correlation coefficient. The correlation coefficient can never be less than -1 or higher than 1.
- 1 =it indicates that linear relationships between the variables are perfect
- 0 = it does not occur in any linear relationship between the variables.
- -1 =it indicates that there is a perfect negative linear relationship between the variables (e.g. During a training session fewer hours worked, leads to higher calorie Burnage).
3) Linear regression (For predictive Analysis)
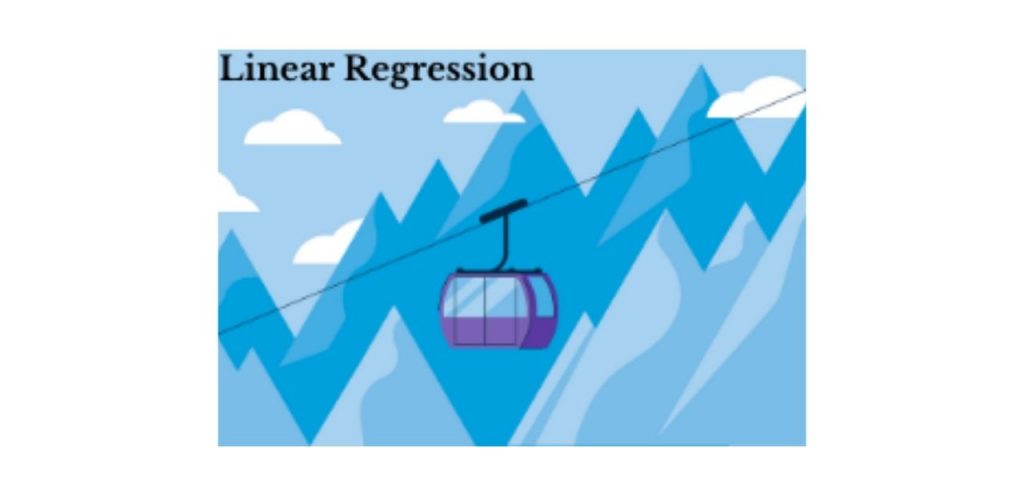
Data scientists use linear regression to show the connection between a dependent variable and more than one independent variable. It involves discovering the ‘line of best fit’ that at least two factors should be addressed. Limiting the number of squared residuals means the line of best fit is found by limiting the squared distances between the focuses and the line of best fit. Basically, the anticipated value minus the actual value is equivalent to residual.
4) Logistic regression (For Classification)
Logistic regression is used to model the probability of a discrete number of outcomes, typically two, on the other hand, it is similar to linear regression. Mostly, Logic regression is used in internet advertising and allows marketers to predict the probability of specific users who will click on specific commercial ads as a yes or no percentage.
Logistic regression has been mainly used for:
- Healthcare to recognize the risk factors behind the diseases and plan for the preventive measures based on disease.
- Based on the gender, age and physical examination, insurance to predict the chances of the policyholder will die before the term of the policy expires.
- Based on annual income, past defaults, and past debts, bankers can predict the chances that a loan applicant will default on a loan or not.
5) Probability Distributions (For identifying the likelihood of random variables)
One of the easy methods to find the probabilities of different possible outcomes in an experiment is Probability Distributions. Normal Distribution, Uniform Distribution, and Poisson Distribution are the different types of distribution.
1.Normal Distribution
Gaussian distribution is another name of normal distribution, it is a bell-shaped curve that is quite well-known for many distributions. Moreover, it includes the IQ score and the height of the people. μ is equal to the mean of the normal distribution, and σ is equal to the variance.
2.Poisson Distribution
The Poisson Distribution means it gives the probability of the number of independent events that take place in a fixed time and also it is a discrete distribution. For Instance, it is used if we want to determine the likelihood of Y patients coming into a hospital on a given day. λ is equal to both the mean and variance.
3.Uniform Distribution
When all the outcomes are uniformly likely, then a uniform distribution is used. For Instance, Dye has a uniform distribution as well as a coin.
6) Confidence Intervals and Hypothesis Testing
There is a strong bond between hypothesis testing and confidence intervals. It is connected with a certain level that the true boundary is within the recommended scope before that the confidence interval recommends a scope of qualities for a boundary that is unknown.
In clinical research to give analysts a more grounded reason for their assessments, the confidence intervals are frequently essential. The premise of any survey or research question and attempts to prove that there is nothing happens by coincidence. For instance, when moving a dice that one number was bound to come up more than the rest.
7) P-values and level of significance
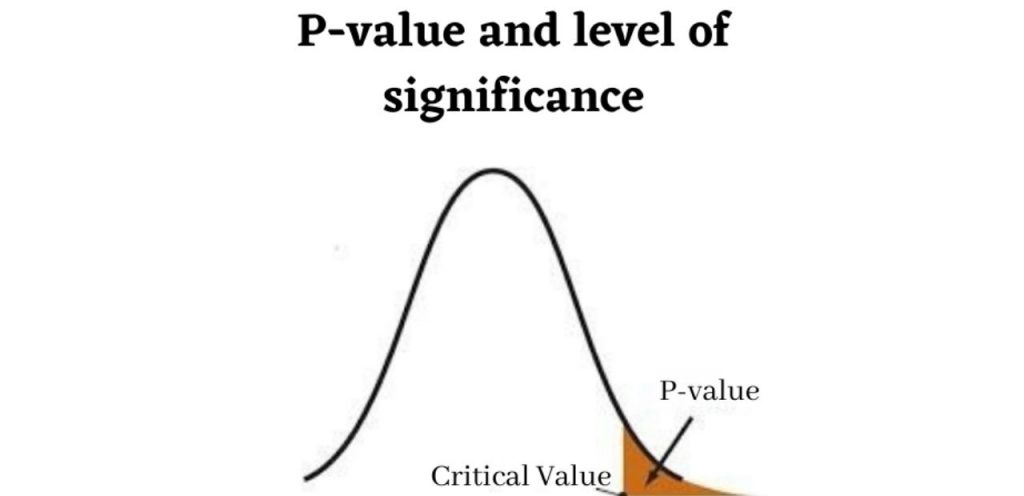
For instance, assume that the p-value is less than the alpha, which means 0.05, then the probability of under 5% that the outcome might have occurred on the basis of some coincidence. As well as,” the p-value of 0;05 is equivalent to saying,” then 5% of the time, we would see this by some coincidence.
8) Z-tests vs T-tests
A Z-test is used to determine whether the means of two populations are different when the sample size is large and the variance is known, also it is a statistical test that is supposed to have a normal distribution and nuisance parameters including standard deviation should be known for an accurate z-test to be implemented. The z-test is also known as the hypothesis test in which the z-statistic goes along with the normal distribution. If the samples are greater than 30, the z-test is used and it is under the central limit theorem and also when the samples are considered as normally distributed then the sample size is larger.
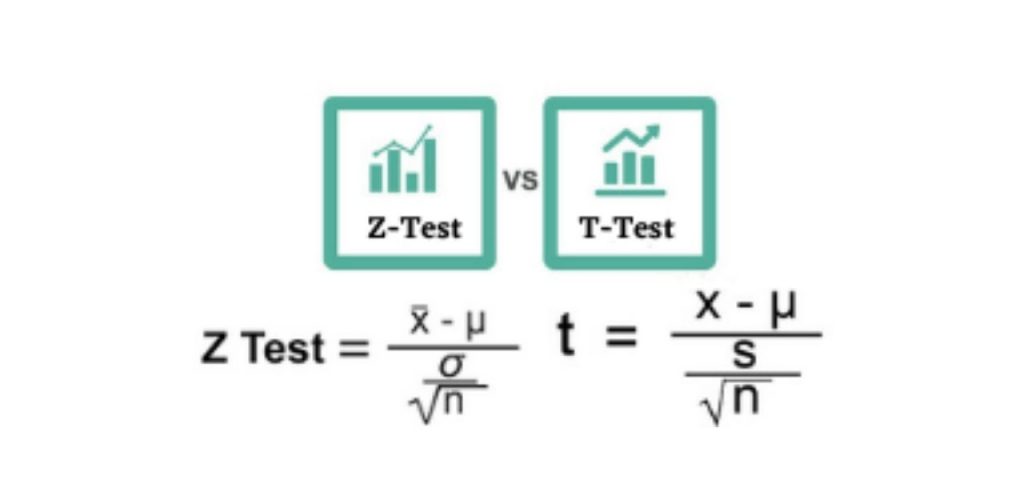 A t-test is used to determine whether there is any significant difference between the means of two sets and they may be related to certain features. It is mainly used in the data sets, for example, when a coin is flipped 100 times and the data set is recorded as the outcome, also it follows a normal distribution and it might have unknown variances. A hypothesis testing tool is used for the t-test, which permits testing of an assumption applicable to the population. A test focuses on the t-statistic, as well the statistical significance is determined by the t-distribution values and the degrees of freedom. One must use an analysis of variance (ANOVA) to conduct a test with three or more means.
9) Central Limit Theorem
One of the most powerful statistics concepts is the central limit theorem. The central limit theorem is one of the most powerful statistics concepts, it conveys that the circulation of the test implies a normal handover. For instance, take a sample from an informational index and access the mean of that sample. When stated differently on various occasions, we would plot every one of our means and mark their frequencies onto a graph and see that a ringer bend, in other words, has made a normal distribution.
10) Maximum Likelihood Estimation (MLE)

Assessing the boundary by expanding the probability of capacity to discover the boundaries that best clarify the observed information are included in Maximum Likelihood Estimation. MLE is a particularly prescient illustrated structure where model boundaries are found through a streamlining issue. Now, the probability work p(y| θ ) describes the probability of noticing information by the given boundary θ.
We are living in an age that is highly saturated with data. Quintillions bytes of data are added to the databases from innumerable activities and phenomenons from multiple sources each day. Data science has become one of the most potential domains which add value to all businesses and industries by making data meaningful. The developments in the field of Machine learning and AI have skyrocketed the possibilities of Data Science. Data Science is an intradisciplinary domain where statistics could be considered as the soul of this field. Thus for mastering the competencies of a Data Scientist, it is important to have in-depth knowledge of statistical concepts. Hence, a candidate preparing to fix his career as a Data Scientist should have a clear understanding of the statistical concepts mentioned above so that they could crack the interview with confidence.